
Managing your finances is an essential skill, and having a Personal Finance Dashboard can help you track your income, expenses, and investments effortlessly. In this tutorial, we will build an interactive finance tracker using HTML, CSS, JavaScript, and Chart.js to visualize financial data dynamically. Let’s get started! 🚀
Why Build a Finance Dashboard?
✅ Easy to Use – Simple transaction input system 💼 ✅ Real-Time Updates – Automatically updates income, expenses, and investments 💵 ✅ Visual Insights – Uses Chart.js to create a financial overview 📊 ✅ Fully Responsive – Works on desktop and mobile devices 📱
Step 1: Set Up the Basic Structure
First, we create the basic HTML structure for the finance dashboard.
<!DOCTYPE html>
<html lang="en">
<head>
<meta charset="UTF-8">
<meta name="viewport" content="width=device-width, initial-scale=1.0">
<title>Personal Finance Dashboard</title>
<script src="https://cdn.jsdelivr.net/npm/chart.js"></script>
<link rel="stylesheet" href="styles.css">
</head>
<body>
<div class="container">
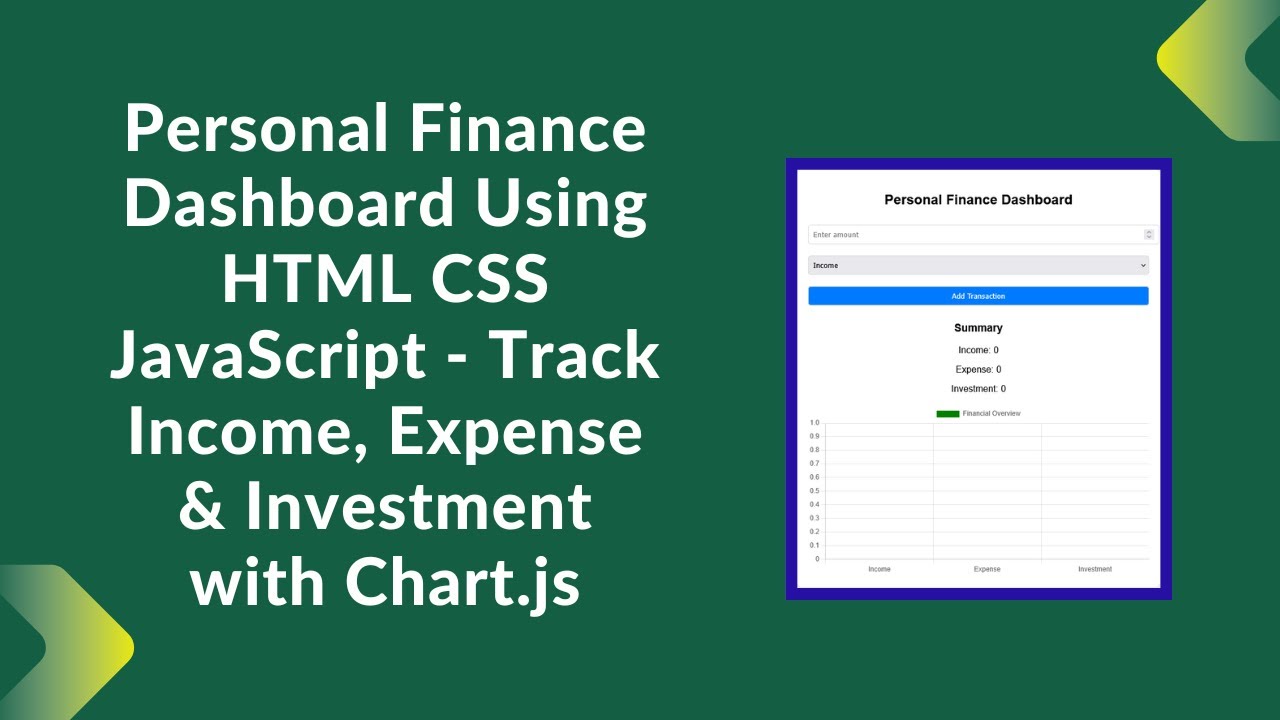
<h2>Personal Finance Dashboard</h2>
<input type="number" id="amount" placeholder="Enter amount">
<select id="category">
<option value="income">Income</option>
<option value="expense">Expense</option>
<option value="investment">Investment</option>
</select>
<button onclick="addTransaction()">Add Transaction</button>
<h3>Summary</h3>
<p>Income: <span id="incomeTotal">0</span></p>
<p>Expense: <span id="expenseTotal">0</span></p>
<p>Investment: <span id="investmentTotal">0</span></p>
<canvas id="financeChart"></canvas>
</div>
<script src="script.js"></script>
</body>
</html>Step 2: Style the Dashboard
We enhance the UI with CSS for a clean and professional look.
body {
    font-family: Arial, sans-serif;
    margin: 0;
    padding: 0;
    background-color: #f4f4f4;
    text-align: center;
}
.container {
    max-width: 600px;
    margin: 20px auto;
    background: white;
    padding: 20px;
    border-radius: 10px;
    box-shadow: 0 0 10px rgba(0, 0, 0, 0.1);
}
input, select, button {
    margin: 10px 0;
    padding: 8px;
    width: 100%;
    border: 1px solid #ddd;
    border-radius: 5px;
}
button {
    background: #007bff;
    color: white;
    cursor: pointer;
    transition: 0.3s;
}
button:hover {
    background: #0056b3;
}
canvas {
    margin-top: 20px;
}
Step 3: Implement JavaScript for Dynamic Updates
Now, we add JavaScript to handle transactions and update the chart dynamically.
let financeData = { income: 0, expense: 0, investment: 0 };

function addTransaction() {
    let amount = parseFloat(document.getElementById('amount').value);
    let category = document.getElementById('category').value;

    if (!amount || amount <= 0) {
        alert("Please enter a valid amount.");
        return;
    }

    financeData[category] += amount;
    updateUI();
}

function updateUI() {
    document.getElementById('incomeTotal').innerText = financeData.income;
    document.getElementById('expenseTotal').innerText = financeData.expense;
    document.getElementById('investmentTotal').innerText = financeData.investment;
    updateChart();
}

let ctx = document.getElementById('financeChart').getContext('2d');
let financeChart = new Chart(ctx, {
    type: 'bar',
    data: {
        labels: ['Income', 'Expense', 'Investment'],
        datasets: [{
            label: 'Financial Overview',
            data: [0, 0, 0],
            backgroundColor: ['green', 'red', 'blue']
        }]
    },
    options: {
        responsive: true,
        scales: {
            y: { beginAtZero: true }
        }
    }
});

function updateChart() {
    financeChart.data.datasets[0].data = [
        financeData.income,
        financeData.expense,
        financeData.investment
    ];
    financeChart.update();
}
Final Thoughts
By following this guide, you have built a Personal Finance Dashboard that allows users to: ✅ Input and track income, expenses, and investments 💰 ✅ Get real-time updates on financial data 🔄 ✅ Visualize transactions using Chart.js 📊
This project is perfect for personal budgeting, business tracking, and financial analysis. You can further improve it by integrating a database for data persistence or adding custom categories for more flexibility.
🚀 Want the full source code? Check out the GitHub repository: GitHub Link
If you found this tutorial helpful, don’t forget to like, share, and subscribe to Madras Academy for more exciting web development tutorials! 🎥🔥
#FinanceDashboard #WebDevelopment #JavaScript #ChartJS #Budgeting #ExpenseTracker #Frontend #Coding #DataVisualization