Debugging JavaScript can sometimes be tricky, but what if you had a tool that instantly checked for syntax errors? In this tutorial, we’ll guide you through building a simple AI-powered JavaScript debugger using HTML, CSS, and JavaScript.
By the end of this guide, you’ll have a fully functional web-based debugger where users can input JavaScript code, check for syntax errors, and receive instant feedback. This tool is perfect for beginners and developers looking for a quick debugging solution! 💡
🔍 Understanding the Role of HTML, CSS, and JavaScript
1️⃣ HTML (HyperText Markup Language)
- Creates the structure of the debugger interface.
- Defines elements like text areas, buttons, and output sections.
2️⃣ CSS (Cascading Style Sheets)
- Enhances the visual appearance of the debugger.
- Styles elements to make the interface user-friendly and appealing.
3️⃣ JavaScript (JS)
- Implements the logic for detecting syntax errors.
- Provides instant feedback to users based on their input.
Now, let’s dive into building the debugger step by step! 🛠️
🚀 Step 1: Creating the HTML Structure
First, set up the basic HTML layout for the debugger.
<!DOCTYPE html>
<html lang="en">
<head>
<meta charset="UTF-8">
<meta name="viewport" content="width=device-width, initial-scale=1.0">
<title>AI-Based Code Debugger</title>
<link rel="stylesheet" href="styles.css"> <!-- Link external CSS -->
</head>
<body>
<div class="container">
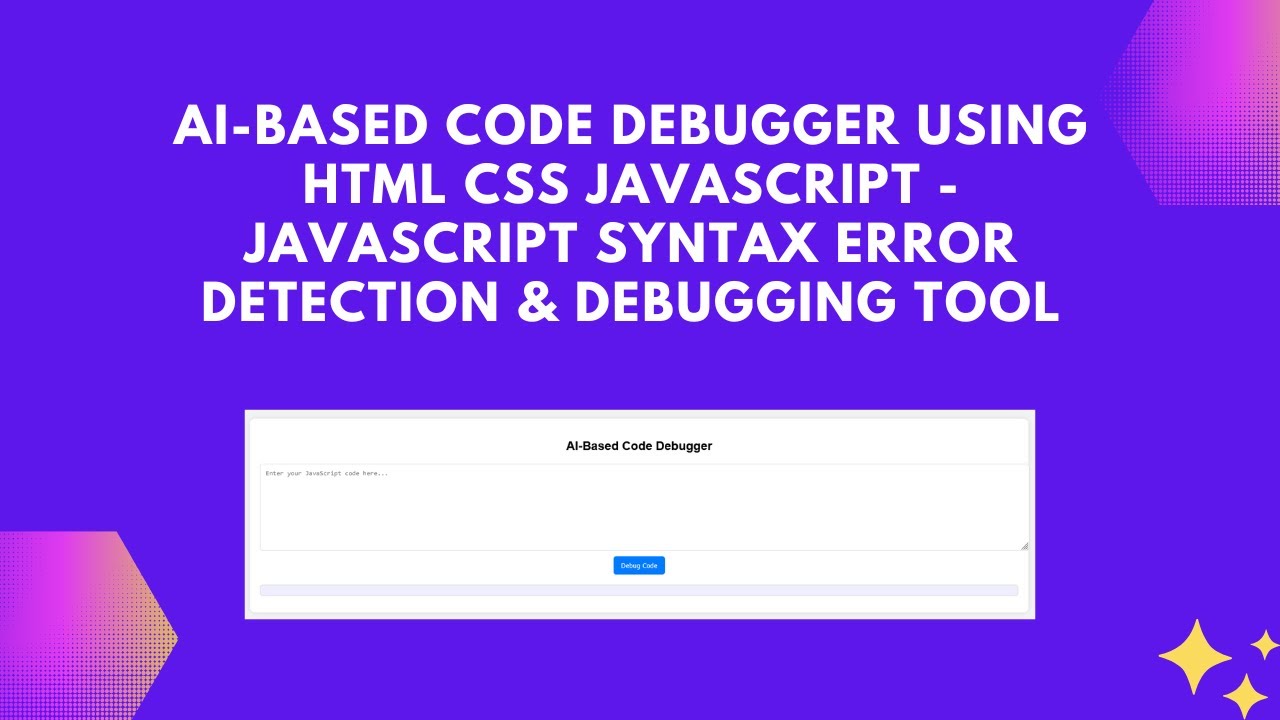
<h2>AI-Based Code Debugger</h2>
<textarea id="codeInput" placeholder="Enter your JavaScript code here..."></textarea>
<button onclick="debugCode()">Debug Code</button>
<pre id="output"></pre>
</div>
<script src="script.js"></script> <!-- Link external JavaScript -->
</body>
</html>
📝 Explanation:
✅ <textarea>: Allows users to input JavaScript code.
✅ <button>: Triggers the debugging function.
✅ <pre>: Displays output or error messages.
🎨 Step 2: Styling with CSS
Now, let’s style the debugger interface for a modern look.
/* styles.css */
body {
    font-family: Arial, sans-serif;
    background-color: #f4f4f4;
    text-align: center;
    margin: 0;
    padding: 20px;
}

.container {
    width: 80%;
    margin: auto;
    background: white;
    padding: 20px;
    border-radius: 10px;
    box-shadow: 0 0 10px rgba(0, 0, 0, 0.1);
}

textarea {
    width: 100%;
    height: 150px;
    padding: 10px;
    border-radius: 5px;
    border: 1px solid #ddd;
    font-family: monospace;
}

button {
    padding: 10px 15px;
    border: none;
    background: #007bff;
    color: white;
    border-radius: 5px;
    cursor: pointer;
    margin-top: 10px;
    transition: 0.3s;
}

button:hover {
    background: #0056b3;
}

#output {
    margin-top: 20px;
    white-space: pre-wrap;
    text-align: left;
    background: #eef;
    padding: 10px;
    border-radius: 5px;
    border: 1px solid #ddd;
}
🎨 What CSS Does:
✅ Adds a clean and responsive design.
✅ Styles the button with hover effects.
✅ Improves the output display for readability.
⚡ Step 3: Implementing JavaScript for Debugging
Now, let’s write the JavaScript logic to check for syntax errors.
// script.js
function debugCode() {
    let code = document.getElementById("codeInput").value;
    let output = document.getElementById("output");

    try {
        new Function(code); // Checks for syntax errors
        output.textContent = "✅ No syntax errors found.";
    } catch (error) {
        output.textContent = "❌ Error: " + error.message +
        "\n\n💡 Suggestion: Check the syntax near the error location.";
    }
}
⚡ What This JavaScript Does:
✅ Uses new Function(code) to evaluate JavaScript syntax.
✅ Displays error messages if there are syntax issues.
✅ Provides real-time feedback to help users debug their code.
📌 Features of the AI-Based JavaScript Debugger
🔹 Instant Syntax Checking – No need to run the code manually.
🔹 User-Friendly Interface – Simple, responsive, and easy to use.
🔹 Real-Time Feedback – Detects errors and gives suggestions.
🔹 Beginner-Friendly – Great tool for learning JavaScript debugging.
🎥 Watch the Video Tutorial
Want to see the step-by-step process in action? Watch the tutorial here:
📂 Get the Full Source Code: GitHub Repository
💡 Conclusion
With this simple AI-powered debugger, you can quickly identify JavaScript syntax errors without running the code. Whether you’re a beginner or an experienced developer, this tool is a handy addition to your coding workflow!
💻 Try it out, improve your debugging skills, and enhance your coding experience!
🔹 If you found this tutorial helpful, don’t forget to like, comment, and subscribe for more web development guides! 🚀
#HTML #CSS #JavaScript #Debugging #WebDevelopment #AI #CodeDebugger #CodingTips