A personalized dashboard is a great way to display useful information such as weather updates, the latest news, task management, and productivity tracking—all in one place! In this tutorial, you’ll learn how to build a stylish and interactive dashboard using HTML, CSS, and JavaScript. This project is perfect for anyone looking to enhance their web development skills with real-time updates and interactive UI components. 🚀
📌 Features of the Personalized Dashboard
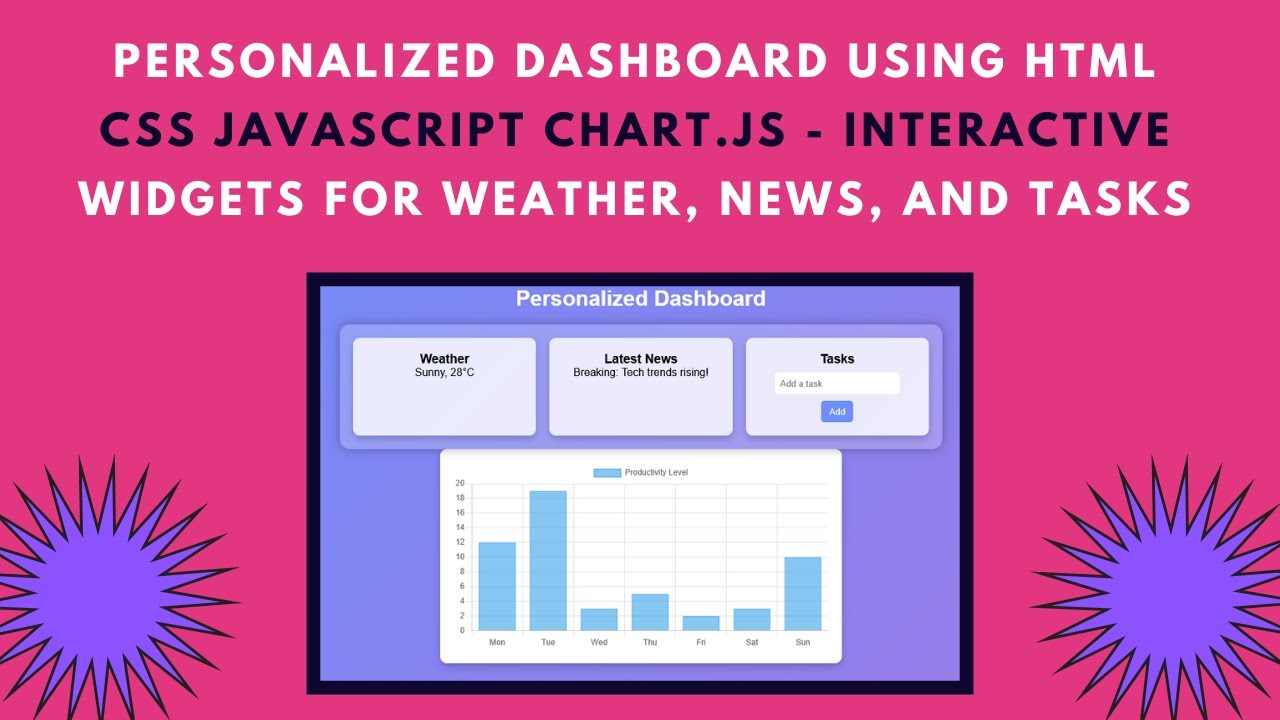
✅ Weather Widget – Displays the latest weather updates 🌤️
✅ News Widget – Shows breaking news headlines 📰
✅ Task Manager – Add and manage daily tasks 📌
✅ Interactive Chart – Visualize productivity levels 📊
✅ Modern UI Design – Styled with sleek CSS and a responsive layout 🎨
🔹 Step 1: Setting Up the HTML Structure
The dashboard consists of multiple widgets, each displaying different types of content. Below is the basic structure:
<!DOCTYPE html>
<html lang="en">
<head>
    <meta charset="UTF-8">
    <meta name="viewport" content="width=device-width, initial-scale=1.0">
    <title>Personalized Dashboard</title>
    <script src="https://cdn.jsdelivr.net/npm/chart.js"></script>
    <link href="https://fonts.googleapis.com/css2?family=Poppins:wght@300;400;600&display=swap" rel="stylesheet">
</head>
<body>
    <h1>Personalized Dashboard</h1>
    <div class="dashboard">
        <div class="widget" id="weather"><h3>Weather</h3><p>Loading...</p></div>
        <div class="widget" id="news"><h3>Latest News</h3><p>Loading...</p></div>
        <div class="widget" id="tasks">
            <h3>Tasks</h3>
            <ul id="task-list"></ul>
            <input type="text" id="task-input" placeholder="Add a task">
            <button onclick="addTask()">Add</button>
        </div>
    </div>
    <div class="chart-container">
        <canvas id="myChart"></canvas>
    </div>
</body>
</html>
🔹 Step 2: Styling with CSS
To create a visually appealing dashboard, use CSS with a glassmorphism effect and a responsive layout.
body {
    display: flex;
    flex-direction: column;
    align-items: center;
    background: linear-gradient(135deg, #6e8efb, #a777e3);
    font-family: 'Poppins', sans-serif;
}
.widget {
    padding: 20px;
    border-radius: 10px;
    background: rgba(255, 255, 255, 0.8);
    box-shadow: 0 5px 10px rgba(0, 0, 0, 0.2);
    transition: transform 0.3s;
}
.widget:hover {
    transform: translateY(-5px);
}
🔹 Step 3: Adding Dynamic Functionality with JavaScript
JavaScript will handle fetching weather and news updates, adding tasks, and rendering the productivity chart.
function fetchWeather() {
    document.getElementById("weather").innerHTML = "<h3>Weather</h3><p>Sunny, 28°C</p>";
}
function fetchNews() {
    document.getElementById("news").innerHTML = "<h3>Latest News</h3><p>Breaking: Tech trends rising!</p>";
}
function addTask() {
    let taskInput = document.getElementById("task-input");
    let taskList = document.getElementById("task-list");
    if (taskInput.value.trim() !== "") {
        let li = document.createElement("li");
        li.textContent = taskInput.value;
        taskList.appendChild(li);
        taskInput.value = "";
    }
}
window.onload = function() {
    fetchWeather();
    fetchNews();
    renderChart();
}
function renderChart() {
    var ctx = document.getElementById('myChart').getContext('2d');
    var myChart = new Chart(ctx, {
        type: 'bar',
        data: {
            labels: ['Mon', 'Tue', 'Wed', 'Thu', 'Fri', 'Sat', 'Sun'],
            datasets: [{
                label: 'Productivity Level',
                data: [12, 19, 3, 5, 2, 3, 10],
                backgroundColor: 'rgba(54, 162, 235, 0.6)',
                borderColor: 'rgba(54, 162, 235, 1)',
                borderWidth: 1
            }]
        },
        options: {
            responsive: true,
            scales: {
                y: { beginAtZero: true }
            }
        }
    });
}
🚀 Conclusion
By following this tutorial, you’ve built a modern and interactive dashboard that combines real-time updates, task management, and data visualization. You can customize and expand this project by integrating APIs for live data, adding user authentication, or even styling it further with frameworks like Tailwind CSS!
💡 Next Steps
✔️ Enhance the weather and news widgets using API calls 🔗
✔️ Store tasks in local storage so they persist on page reload 🛠️
✔️ Add a dark mode toggle for better user experience 🌙
📢 Stay Connected
If you enjoyed this tutorial, don’t forget to like, comment, and subscribe to stay updated on more exciting web development content!
🔗 GitHub Repository: Access Source Code
🎥 Video Tutorial:
Happy Coding! 🚀🎯